Herbicide resistance
Herbicide resistance is the inherited ability of a plant to survive and reproduce following exposure to a dose of herbicide normally lethal to such plants. It results from selection pressure producing individual plants with a mutation that provides resistance and allowing these individual plants to become established and multiply. Resistance differs from tolerance, where all individuals of a species will normally survive a herbicide treatment.
The most serious herbicide resistance, in terms of the extent and intensity of use, is resistance to glyphosate. Glyphosate forms the basis of the cheapest and most widely-used herbicides globally. Its ease of use, low toxicity and low cost have made it the preferred means of roadside vegetation control and weed management. Repeated application of glyphosate alone along roadsides has resulted in resistant weed species evolving overseas.
The Research and Guidelines Steering Group supported and contributed to research being led by the Foundation for Arable Research to prevent the development of glyphosate resistance within weed species within New Zealand. No cases of resistance to glyphosate were recorded before 1996, when resistance was found to be established in ryegrass in NSW, Australia. Since then a further 32 species have been reported to have developed resistant individuals. Many of those weed species are found in New Zealand and the first cases of resistance in ryegrass populations were confirmed in New Zealand in 2012.
This is no longer a question of potential risk. It is more important than ever now that road asset managers have in place appropriate protocols for monitoring roadside spraying and reporting incidences of apparent failure of spray treatments, and for rotating treatments. Comprehensive Glyphosate resistance management strategies (August 2014) have been prepared and promulgated. A brief Glyphosate resistance matters for roading managers was released in 2012. Additional information on the glyphosate resistance research project and background information on glyphosate are available here.
A few common questions are answered below. We are grateful to Hossein Ghani Zadeh, Kerry Harrington, Trevor James and David Woolley for allowing parts of the research undertaken by the Institute of Agriculture and Environment at Massey University to be reproduced here.
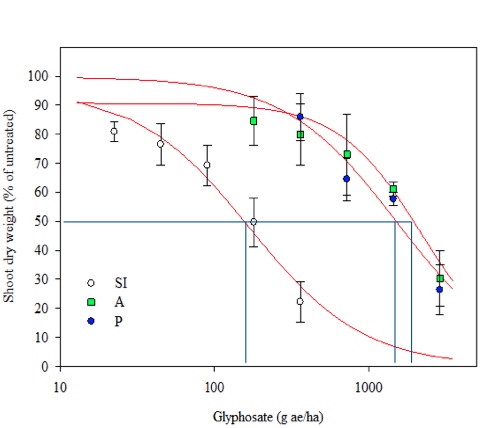
What does resistance look like? The graph below shows the normal response curve of a susceptible individual (SI) against the responses of two resistant individuals (A and P; both specimens of Italian Ryegrass – Lolium multiflorum), showing a ten-fold increase in glyphosate application to achieve a comparable reduction to 50% shoot dry weight compared with untreated individuals.
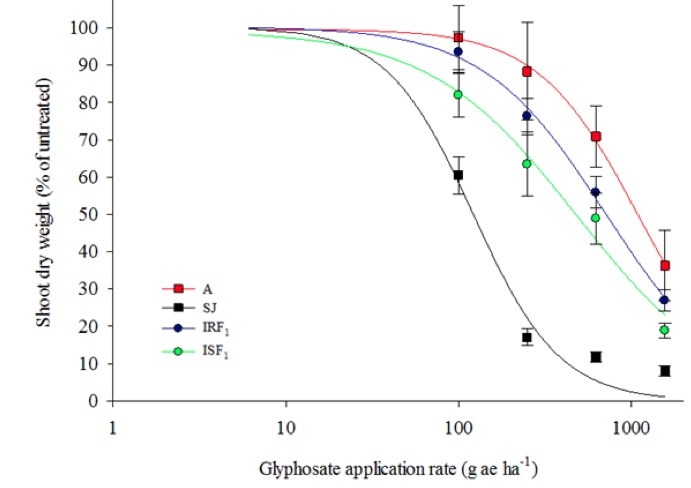
Can resistance be inherited from susceptible plants to produce resistant offspring? Resistance can be transferred by pollen. The graph below shows the response curves for a resistant specimen (A – as above) and a susceptible specimen (SJ), with reponse curves for an individual produced from crossing a resistant specimen with pollen from a susceptible specimen (IRF1) and an individual produced from crossing a susceptible specimen with pollen from a resistant specimen (ISF1). The offspring are six and five times more resistant than a susceptible specimen, respectively.
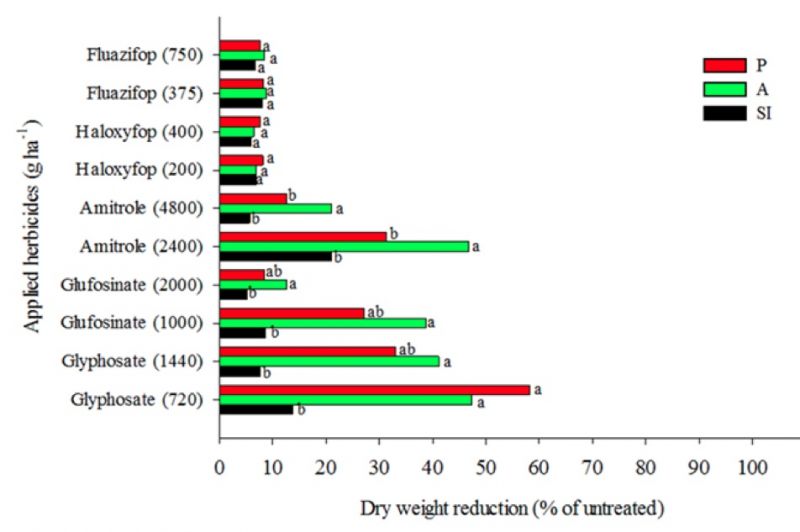
Can mutiple herbicide resistance develop? Research suggests that care needs to be taken to avoid glyphosate-resistant individuals becoming resistant to popular alternative herbicides, such as glufosinate and amitrole. The graph below compares the responses of two resistant populations of Italian ryegrass (A and P) and normal susceptible individuals (SI) to a variety of common herbicide treatments.
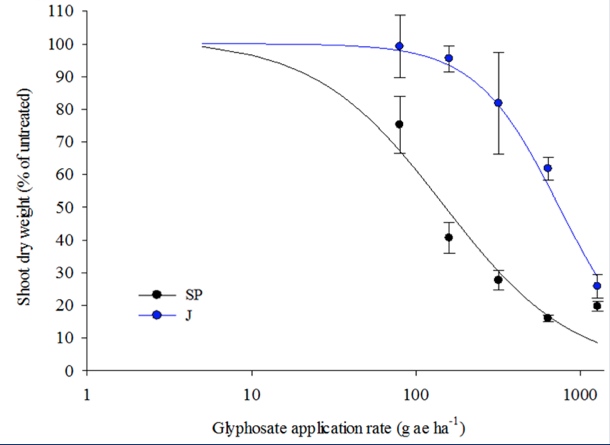
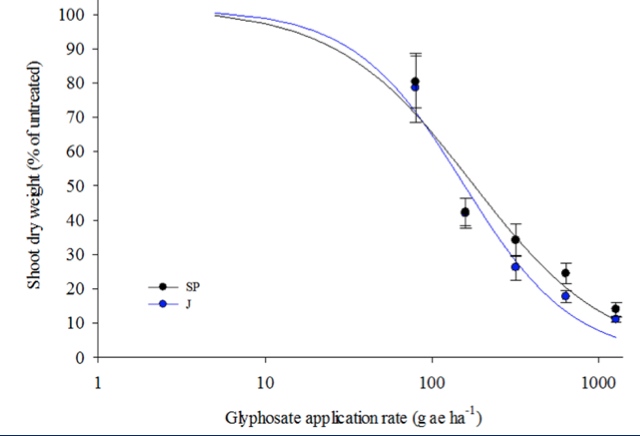
Is resistance to glyphosate temperature sensitive? The research indicates a markedly different response by a glyphosate-resistant individual in warmer temperatures if it is treated in cooler temperatures. The upper graph below shows the standard response curves for a resistant population (J – Perennial ryegrass) and a susceptible population (SP) when treated in warmer temperatures. The lower graph below shows the very different response curves for specimens of the same populations treated in cooler temperatures.